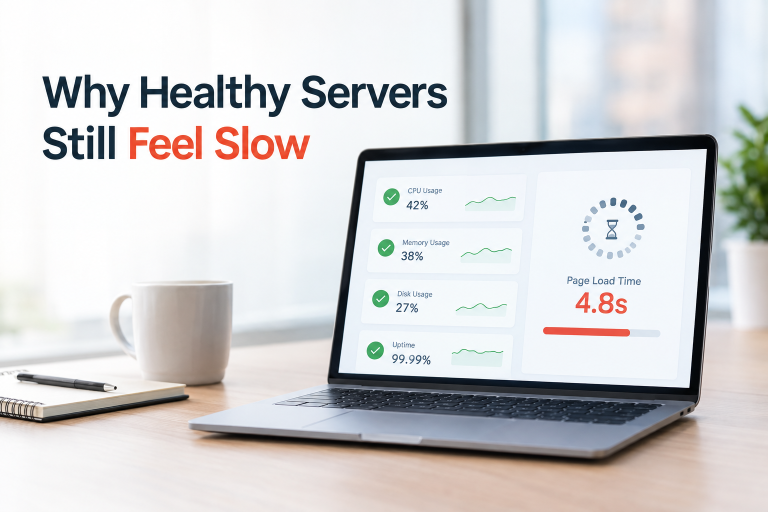

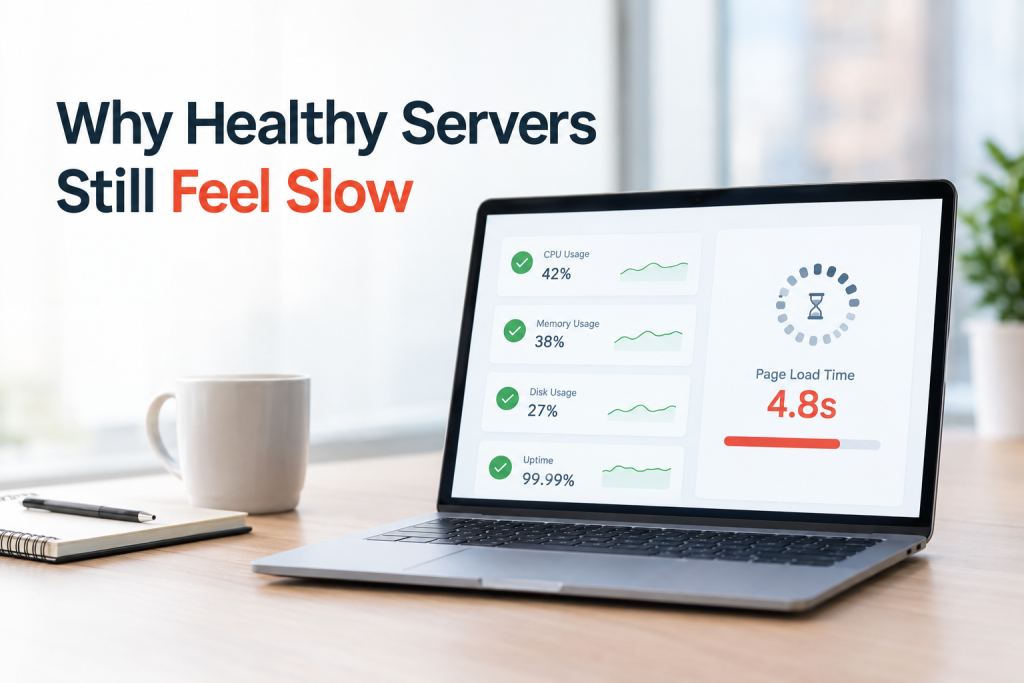
Support just flagged another wave of complaints about a sluggish checkout. Your team pulls up the dashboard. CPU sits under 50%. Memory looks fine. Uptime reads 99.99%. Every light is green, and yet the complaints keep coming. You have run into one of the most frustrating puzzles in IT operations. It is the question of why healthy servers still feel slow, and if it feels personal, that is because it is costing you customers right now.
This gap between “healthy” infrastructure and “fast” infrastructure trips up more teams than you would expect, and it is expensive. Slow pages quietly drain revenue, erode trust, and send frustrated users straight to a competitor, all while the IT team insists nothing is wrong on their end. In this post, we will break down why healthy servers still feel slow, what it is actually costing you, and exactly how to fix it so this stops happening.
The Illusion of a “Healthy” Server
Most teams define server health using a narrow set of metrics. They track CPU load, memory usage, disk space, and uptime. If these numbers stay within range, the server earns a healthy label. But these metrics were built to catch failures, not slowdowns. A server can be technically up and still deliver a painfully slow experience, because these numbers rarely capture what actually matters to the end user: response time and the total time a request takes to travel through the stack.
This is really at the heart of why healthy servers still feel slow. The definition of “healthy” is often too shallow. A server with plenty of free memory can still choke under a poorly optimized database query. A machine with low CPU usage can still serve requests slowly if network latency, DNS resolution, or an overloaded load balancer adds delay along the way. Health checks answer one question only: is it running? They rarely answer whether it is running well.
Where the Real Slowdowns Hide
Picture a single user request. It passes through several layers before it becomes a page load or an app response. It travels across the client side network, through a DNS lookup, into a load balancer, onto an application server, into a database, sometimes out to a third party API, and back again. A bottleneck at any one of these layers can add real delay, even while every individual server in that chain reports itself as healthy.
A few common culprits hide in plain sight:
- Inefficient database queries. A query that scans an entire table instead of using an index can quietly add hundreds of milliseconds to every request, even when the database server shows low resource usage.
- Network latency and DNS delays. Slow DNS resolution or poor routing can add noticeable lag before a request even reaches your application.
- Noisy neighbors in shared cloud environments. On multi tenant infrastructure, another workload on the same physical hardware can eat into your resources without triggering a single alarm.
- Unoptimized code and memory leaks. These issues rarely show up as a server health problem until performance has already degraded for a while.
- Overloaded third party integrations. If your app depends on outside APIs, their slowdowns become your slowdowns too, and they will not appear on your server’s health dashboard at all.
- Cold starts and weak caching. Poorly configured caching forces the system to repeat expensive work instead of serving results it already has.
None of these problems will trip a basic health check. That is exactly why healthy servers still feel slow to the people using the application, even while the infrastructure dashboard shows nothing but green lights.
What This Slowness Is Actually Costing You
This is not a minor annoyance. It hits revenue directly, and the numbers are brutal. Ecommerce sites that load in one second convert at roughly 3.05%, while sites that take five seconds convert at just 1.08%. That is nearly three times the sales, lost to nothing but speed. A one second delay alone can drop conversions by 7%, and 82% of consumers say slow speed changes their buying decisions. Research from Google backs this up too: more than half of mobile visitors abandon a page that takes longer than three seconds to load.
Reference: How Page Load Time Affects Your Conversion Rate — Pingdom
Now add the hidden costs. Support teams burn hours chasing tickets that trace back to a “healthy” server no one thought to question. Engineers waste sprints debugging symptoms instead of root causes. Customers quietly churn without ever filing a complaint at all. Every day this goes unresolved, you are paying for it, whether you can see the charge on a dashboard or not.
The Monitoring Gap: Measuring the Wrong Things
Traditional monitoring grew up in a different era. Back then, the biggest risk was a server crashing outright. Today, the bigger risk is often a server that stays up but degrades quietly. This is where basic uptime checks fall short of true performance monitoring.
This is exactly the gap that cloud monitoring and management services exist to close. Instead of only tracking whether a server is alive, a mature monitoring stack tracks real user metrics. It watches request latency by endpoint, database query performance, error rates, third party response times, and full transaction traces. This deeper visibility separates teams who catch problems before customers notice from teams who only find out after support tickets pile up.
If your current setup only tells you a server is up, you are missing half the picture. Real performance monitoring answers a harder question. Is it up and fast, for every type of request, at every hour, under real traffic? A server that looks perfectly healthy on paper can still push you well past that threshold.## Why This Problem Keeps Getting Worse
Applications keep growing more distributed. They now span microservices, containers, serverless functions, and multiple cloud regions. Every added layer creates a new place for a slowdown to hide. A single user request might touch a dozen services before it finishes. Each service can report healthy on its own, while the combined delay across all of them adds up to a slow and frustrating experience for the person waiting on the other end.
This complexity is pushing growing businesses to rethink their whole approach to infrastructure. Keeping servers running is no longer enough. Teams need continuous visibility, proactive tuning, and architecture built for speed from day one. This is precisely where cloud optimization services come in. They do more than keep systems online. They actively tune resource allocation, caching strategy, query performance, and workload distribution, so that healthy and fast finally mean the same thing.
Closing the Gap Between Healthy and Fast
So what actually fixes this? A few practical shifts make a real difference.
- Track user experienced latency, not just server vitals. Measure how long real requests take, broken down by endpoint and region, instead of relying only on CPU and memory graphs.
- Set up distributed tracing. In a multi service architecture, tracing shows exactly which hop adds delay, instead of leaving you to guess.
- Audit database performance often. Slow queries cause a large share of “healthy but slow” servers, and they are usually fixable.
- Right size and tune infrastructure continuously. Resource allocation that made sense six months ago may not match today’s traffic.
- Test under realistic load. A server that passes a simple ping test can still buckle under real concurrent traffic.
- Review third party dependencies. Monitor external APIs with the same rigor you apply to your own systems, since their slowdowns become your problem too.
Teams that make these shifts stop asking why healthy servers still feel slow. They redefine what healthy actually means: fast, responsive, and reliable under real conditions, not just technically online.
The Bigger Picture
Uptime alone was never the real goal. A great user experience was always the point. A server that stays up but runs slow still costs you customers, revenue, and trust. It just does so more quietly than an outright outage would. That is the uncomfortable truth behind why healthy servers still feel slow. Traditional health metrics were built to prevent disasters, not to guarantee great performance.
Closing that gap takes a shift in mindset. Teams need to move from reactive uptime checks to proactive, end to end performance management. That means looking past the green checkmarks and asking harder questions about latency, query efficiency, and real user experience across every layer of the stack.
If your team keeps hearing that the app feels slow, despite dashboards that look perfectly fine, do not wait for it to get worse. Every week you delay is another week of lost conversions, frustrated customers, and engineers chasing the wrong signals. Take a closer look at what you are actually measuring, find what is slipping through the cracks, and fix it before it costs you more.
Because the moment you stop asking why healthy servers still feel slow, and start acting on it, you will have already found the fix. If you want a second set of eyes on where your slowdown is hiding, a quick infrastructure audit can usually find it within days, not months. That is a small price next to what slow servers are quietly costing you every single day they stay unfixed.