

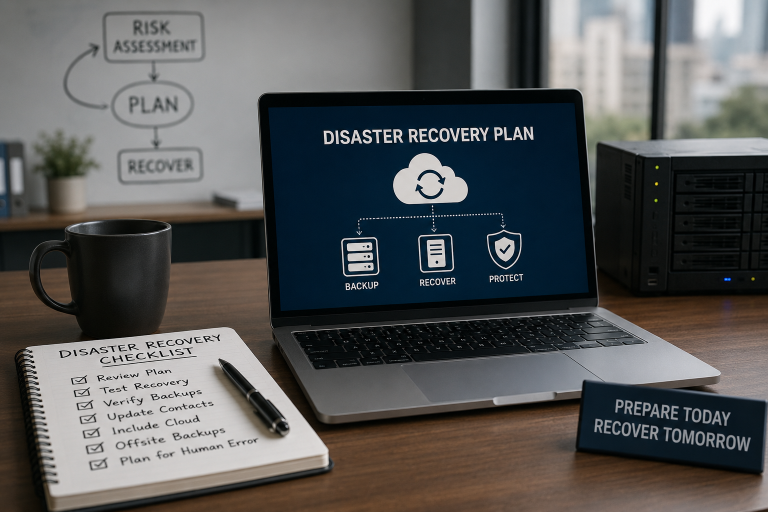
Disaster Recovery Mistakes and How to Avoid Them
Ask any IT leader if their company has a disaster recovery plan. Almost everyone will say yes. Ask them when they last tested it, and the confidence usually drops fast.…
Read article →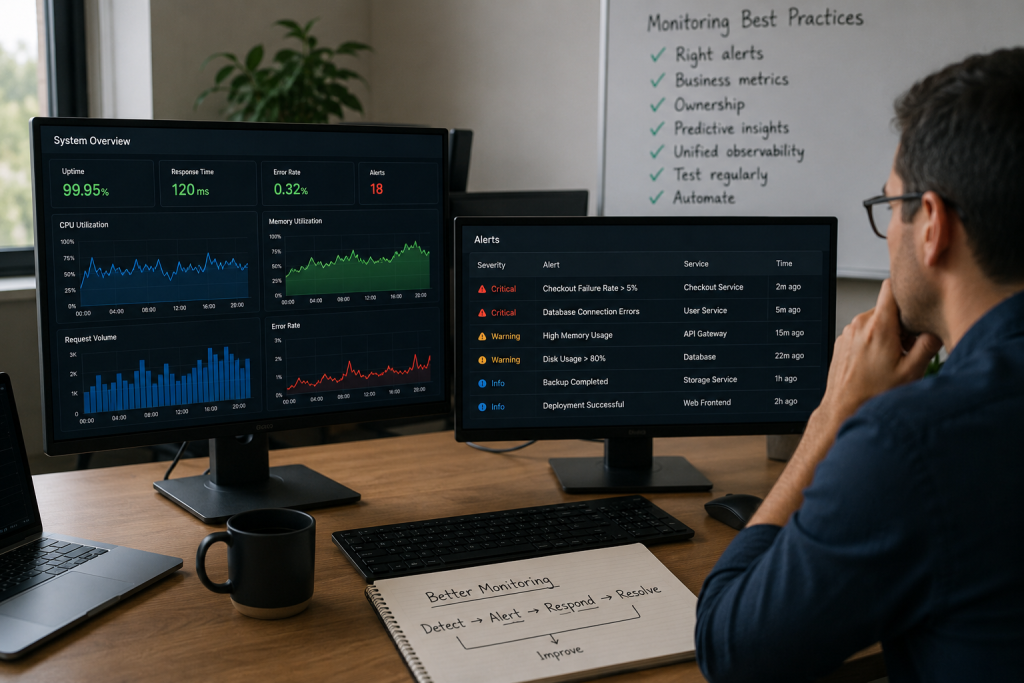
If your team only learns about outages from angry customer emails, you don’t have a monitoring problem. You have a pain problem. In fact, this pain usually comes from a handful of avoidable IT monitoring mistakes. These mistakes build up quietly over time. The good news is that every one of them has a fix. Fixing them rarely means buying new tools. Instead, it usually means changing how you use the tools you already have.
This post walks through the most common monitoring mistakes companies make. First, we’ll explain why they hurt more than teams realize. Then, we’ll show you exactly how to fix each one.
Teams often treat every metric as equally important. Because of this, it’s one of the most common IT monitoring mistakes out there. Teams wire up dozens of dashboards and thresholds. As a result, Slack channels flood with hundreds of alerts a day within weeks. Eventually, engineers stop reading them. Then a real incident hits. Unfortunately, it gets buried under noise or muted entirely.
Fix it this way: Tier your alerts. After all, not everything deserves a page at 2 AM. Split alerts into three buckets. Critical alerts mean customers are affected right now, so these need immediate action. Warning alerts, on the other hand, can wait until business hours. Informational alerts, meanwhile, just get logged. Instead of pushing notifications, review them weekly.
Also, use dynamic thresholds instead of static ones. This way, alerts adjust based on traffic patterns and seasonality. Otherwise, a fixed number from six months ago rarely still makes sense.
Example: For instance, an e-commerce team once received over 300 alerts a day from a single API endpoint. Most of these flagged normal traffic spikes during flash sales. After tiering alerts and adding dynamic thresholds, that number dropped to under 20 a day. As a result, engineers finally started responding to alerts again instead of ignoring them.
CPU looks fine. Similarly, memory and disk look fine. Yet checkout is still failing for 12% of users. This happens because most monitoring stacks focus only on infrastructure metrics. Consequently, they ignore business level indicators like successful transactions or signup completion rates.
Here’s the solution: Layer business metrics on top of infrastructure metrics. In other words, treat a checkout failure spike like a server outage. After all, to your customer, it feels the same either way.
Many organizations treat monitoring as everyone’s job. In practice, however, that means it becomes no one’s job. Engineers build dashboards, then move to other teams. Afterward, nobody maintains them. Over time, alert thresholds slowly stop reflecting reality.
Solve it like this: Assign clear ownership. Specifically, use a rotating on call model with a documented escalation path. This is exactly where a provider of cloud monitoring and management services earns its value. Because of this kind of support, a dedicated team watches your systems around the clock. They follow defined runbooks instead of hoping someone notices a midnight anomaly.
Most teams only check monitoring data after something breaks. In other words, that’s not really monitoring, that’s an autopsy. True monitoring maturity, by contrast, catches problems early. For example, it flags a slow memory leak three days before it crashes your system, not three minutes after.
Correct this by: Investing in trend analysis and anomaly detection. Instead of relying only on static threshold alerts, track patterns week over week and month over month. For instance, a disk filling up 2% faster each week will eventually run out. Predictive monitoring catches that trend early, while a static “disk at 90%” alert catches it too late.
Example: In one case, a SaaS company noticed their database storage climbing steadily for weeks. However, nobody flagged it, since it stayed under the 90% static alert threshold. Eventually, it crossed 100% during a weekend, causing a full outage. A simple trend alert at 70% growth rate would have caught this days earlier.
Many companies run separate tools for infrastructure, application performance, logs, and uptime checks. Unfortunately, none of these tools talk to each other. So when an incident hits, engineers waste critical minutes switching between dashboards. As a result, they struggle to connect what happened where.
Address it by: Consolidating into a unified observability stack. At minimum, integrate your existing tools so alerts, logs, and metrics live in one place. Ultimately, this single change can cut your diagnosis time dramatically.
Ask yourself an uncomfortable question. When did you last test whether your alerts actually fire? Most teams never do this. Therefore, they only discover broken monitoring during a real incident, when it’s already too late.
Here’s how to handle it: Run regular fire drills. Specifically, deliberately trigger conditions that should trip an alert. Then confirm the whole chain works, from detection to notification to response. In short, treat your monitoring system as something that needs monitoring too.
An alert without a follow up action just creates extra work. So if your team fixes the same recurring issue every week manually, automate it instead. After all, repetition is a signal, not a routine to accept.
Turn this around by: Building automatic remediation into your monitoring pipeline. For example, restart failed services automatically, scale resources under load without waiting for a human, and roll back bad deployments the moment they get flagged. Providers offering 24/7 IT Monitoring services often build this kind of automation in by default. As a result, common issues get fixed before anyone even sees the alert.
SaaS products carry extra complexity. For instance, they serve multiple tenants at once, depend on third party APIs, and ship frequent deployments while customers expect near perfect uptime. Because of this, a minor monitoring mistake becomes a revenue problem fast. Consequently, cracks show up quickly, usually as customer churn.
We’ve explored this in more depth elsewhere. In fact, many SaaS monitoring strategies fail even when the underlying tools are solid. So it’s worth reading if you’re evaluating whether your current setup can scale: Why SaaS Monitoring Strategies Fail.
None of these fixes require ripping out your existing stack. Instead, most are simple process and ownership changes. First, tier your alerts by real business impact. Next, track business metrics, not just infrastructure health. Then, assign clear ownership around the clock. After that, shift from reactive to predictive monitoring. Also, bring your tools into one observability view. Finally, test your alerts on a regular schedule and automate the fixes you keep repeating by hand.
Strong teams don’t necessarily own more monitoring tools. Instead, they simply avoid the common IT monitoring mistakes that quietly pile up elsewhere. Ultimately, that difference separates teams who sleep soundly from teams stuck firefighting every night.
Sometimes your team gets stretched too thin to fix this alone. When that happens, it’s a clear signal to bring in outside support. For example, an experienced provider gives you continuous coverage and mature tooling. Because their engineers handle tuning and triage every day, your internal team can focus on building your product instead of babysitting dashboards.
Monitoring shouldn’t cause pain. Done right, it quietly stops pain before it ever reaches your customers.
Ask any IT leader if their company has a disaster recovery plan. Almost everyone will say yes. Ask them when they last tested it, and the confidence usually drops fast.…
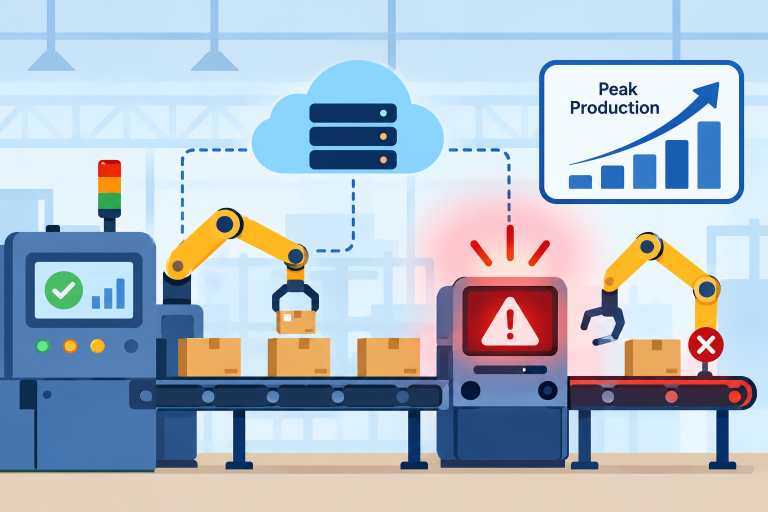
Read article →Every plant manager knows the feeling: the order book is finally full, the lines are running at full tilt, and then, without warning, a system stalls. Screens freeze, sensors stop…
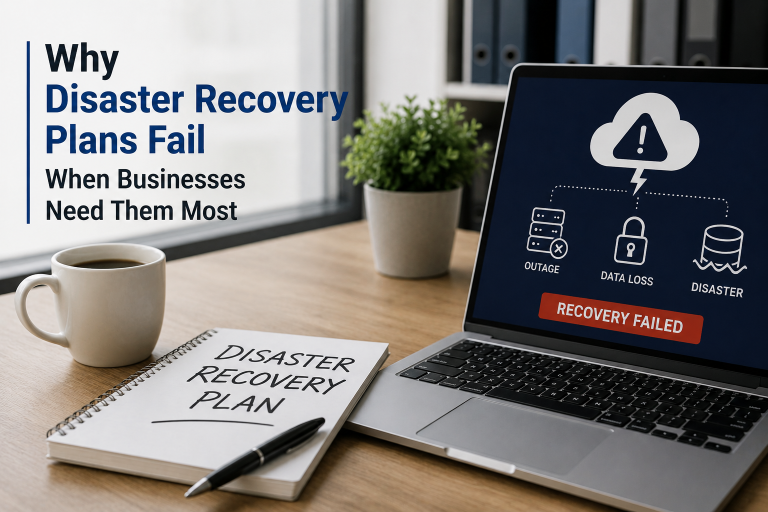
Read article →Most companies believe they are prepared for a crisis. They have a disaster recovery plan, regular backups, and assume everything will work when disaster strikes. Then disaster strikes-a ransomware attack,…
Read article →Tell us where you are and what's slowing you down. A senior engineer will get back to you within one business day.
Our team will get back to you within one business day.
Leave a Reply