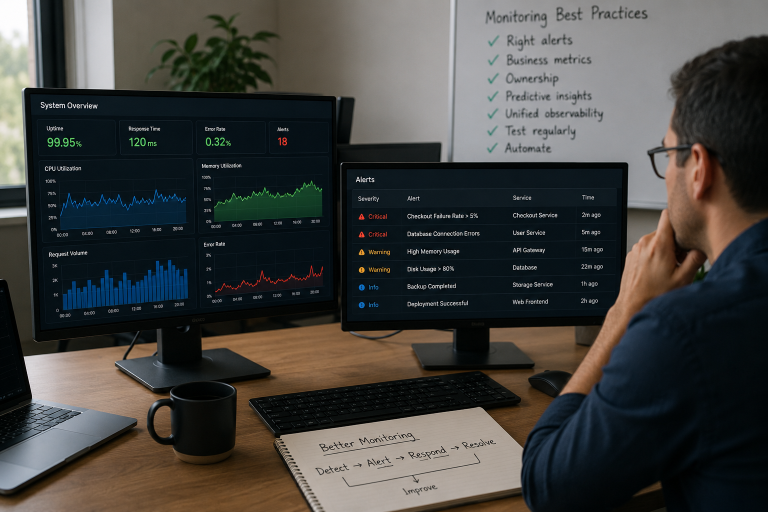
As your business increase in size, your network and IT infrastructure expand. It becomes almost impossible to manually monitor an elaborated IT infrastructure as it is a pretty complicated and time-consuming process. Therefore, organizations need a fast and effective solution that can constantly monitor their IT infrastructure and maintain a log of the devices in terms of availability, health status, and performance. An efficient infrastructure monitoring encompasses diagnosing performance and availability issues across every component of your infrastructure, including the hardware, the network, the operating system, the storage, the devices, the applications and the virtualized environment.
Multiple performance monitoring tools are available in the market to make your IT infrastructure efficient and manageable. An effective IT monitoring tool can help you with several services, including:
- Easy addition and removal of devices or services to be monitored
- Availability and performance monitoring
- Network and device health monitoring
- Network and data movement monitoring
- Reporting and log maintaining
- Dashboards and Visualization
- Alerting the appropriate persons to notify that (if) something goes wrong
Most of the popular and in-trend IT infrastructure monitoring solutions are cloud-based as a service tools. Here is the list of the top ten infrastructure monitoring tools and their basic features.
1. OpManager
ManageEngine’s OpManager is an efficient, end-to-end network performance monitoring software that checks all your hardware and processes to ensure their up-to-date performance. It provides leading-edge defect and performance management functionality across different IT resources like routers, firewalls, switches, physical and virtual servers, VoIP call paths, and other IT infrastructure devices. It offers the application and service-specific monitoring for both Windows Server and Linux.
This tool even allows the IT infrastructure consulting services to calculate and build region-wise bandwidth reports monthly.
2. Zabbix
Zabbix is an open-source all-in-one network monitoring software. It comprises prebuilt official and community-developed templates that facilitate monitoring networks, applications, and endpoints and can even automate some monitoring processes. This is an effective monitoring solution for networks, servers, virtual machines (VMs), and cloud services. Zabbix provides monitoring metrics, including network utilization, CPU load, and disk space consumption. Some of the unique features of the software are web-based configuration, monitoring templates for quick and easy setup, and auto-discovery.
3. ScienceLogic SL1
Another trendy tool is ScienceLogic SL1. This is a system and application monitoring tool and also a performance management platform. ScienceLogic enables organizations towards intelligent & automated IT; this tool is designed to simplify data centre, cloud, and network monitoring with an all-in-one platform.
4. LogicMonitor
Additionally, LogicMonitor offers organizations an agentless SaaS-based monitoring platform. Furthermore, it provides prebuilt integrations along with an open API, making deployment and integration more efficient. As a result, the platform delivers comprehensive monitoring across servers, applications, websites, networks, and containers, while also providing valuable insights and reporting capabilities. To achieve this, organizations host the application on a Linux or Windows server within their infrastructure. Then, the platform uses standard monitoring protocols to monitor devices across the environment, ensuring broad visibility and operational efficiency.
5. SolarWinds Server & Application Monitor
SolarWinds Server & Application Monitor (SAM) is designed to deliver application and server monitoring facility to organizations. This tool can monitor your applications and their supporting infrastructure running on-premises, in the cloud, or in a hybrid environment. SAM also allows self-service for easy setup, more than 1200 monitoring templates, and customization options to make the solution suitable per different company requirements. It can also be integrated with other SolarWinds products.
6. Dynatrace
Moreover, the Dynatrace Software Intelligence Platform uses artificial intelligence to monitor and optimize application performance, IT infrastructure, software development processes, and user experience. In addition, it combines application performance monitoring (APM) with digital business analytics capabilities, providing organizations with deeper operational insights. As a result, businesses can better understand system behavior and performance trends. Furthermore, Dynatrace leverages AI-powered algorithms to enable continuous APM self-learning. Consequently, the platform delivers predictive alerts that help teams identify and resolve potential issues proactively before they impact users.
7. Datadog
Datadog is a performance monitoring service for cloud-scale applications. This APM is designed for monitoring servers, databases, tools, and services, through a SaaS-based data analytics platform. Datadog is an effective performance monitoring and security platform that provides you clear visibility into your overall IT stack from a unified platform.
8. Spiceworks Help Desk
Additionally, Spiceworks Help Desk offers multiple free tools for IT network management and support ticketing. Moreover, this free help desk software provides a fully customizable support experience tailored to organizational needs. For example, Spiceworks helps de-clutter your inbox by centralizing all trouble tickets submitted through the platform. As a result, support teams can manage requests more efficiently. Furthermore, users can quickly respond to tickets with status updates through HTML email notifications. In addition, the software’s inventory management system provides comprehensive device information, simplifying asset management. Beyond that, the Spiceworks Network Monitor keeps IT teams informed about potential infrastructure issues, thereby enabling faster detection and resolution of problems.
9. PRTG Network Monitor
Considering its easy installation and simple usage, PRTG Network Monitor is one of the best monitoring tools in the market. This agentless network monitoring software comprises network, server, and application monitors to monitor the entire infrastructure stack underpinning any running software. It ensures that your computer systems are operating smoothly without any outage. PRTG offers an all-in-one solution including network, bandwidth, server and application monitoring, alerting, and robust reporting. Though PRTG can only be installed on Windows OS, it can monitor different types of devices, including Linux, Windows, Cisco, HP, VMware, etc.
10. Nagios
Nagios is one of the oldest but effective, Linux-based performance monitoring solution that is very flexible, powerful, and the services can be extended with several plugins. Nagios comes in two ways: Nagios Core, a free and open-source and Nagios XI, the paid enterprise edition. Multiple features of Nagios XI can be enjoyed with Nagios Core also with the use of plugins. The software with multiple APIs and community-build add-ons allows you to integrate and monitor in-house and third-party applications for optimized scaling.
11. Grafana
Grafana is an open-source observability and data visualization platform widely used for building rich, interactive dashboards. While it doesn’t collect metrics on its own, Grafana connects to virtually any data source including Prometheus, InfluxDB, Elasticsearch, MySQL, PostgreSQL, AWS CloudWatch, and more to visualize metrics, logs, and traces in a unified interface.
Key features include:
Flexible dashboards— drag-and-drop panels with dozens of visualization types (graphs, heatmaps, tables, gauges)
Alerting — set threshold-based alerts and route notifications to Slack, PagerDuty, email, and more
Data source agnostic — works with 80+ data sources out of the box
Grafana Cloud — a fully managed SaaS version for teams that don’t want to self-host
Grafana Loki — integrates log aggregation alongside metrics for a more complete observability picture
Grafana is a must-have in any modern infrastructure stack, especially for teams that need customized, visually compelling dashboards across hybrid and multi-cloud environments.
12. Prometheus
Prometheus is an open-source systems monitoring and alerting toolkit originally built at SoundCloud and now a graduated project of the Cloud Native Computing Foundation (CNCF). It has become the de facto standard for metrics collection in Kubernetes and cloud-native environments.
Key features include:
Pull-based metrics collection — scrapes metrics from instrumented applications and exporters at defined intervals
Powerful query language (PromQL) — enables flexible, real-time querying and aggregation of time-series data
Multi-dimensional data model — labels allow slicing and dicing metrics by any combination of attributes
Alertmanager — handles deduplication, grouping, and routing of alerts to on-call systems
Native Kubernetes support— integrates seamlessly with Kubernetes for cluster-level and pod-level monitoring
Extensive exporter ecosystem — exporters available for Linux, MySQL, PostgreSQL, Redis, Nginx, AWS, and hundreds more
Prometheus is typically paired with Grafana for visualization, making the **Prometheus + Grafana** combo one of the most popular open-source observability stacks in production today.
How to Choose the Right Infrastructure Monitoring Tool
With so many options available, picking the right monitoring tool can feel overwhelming. Here’s a practical framework to guide your decision:
1. Define Your Monitoring Scope
Start by identifying what you need to monitor: servers and hardware, cloud infrastructure, applications and microservices, networks, containers and Kubernetes clusters, or some combination of all of the above. Tools like Prometheus and Grafana excel in cloud-native and container-heavy environments, while tools like PRTG and OpManager are better suited for traditional on-premises networks.
2. Consider Your Team’s Technical Maturity
Open-source tools like Prometheus, Grafana, and Zabbix offer tremendous flexibility but require setup, configuration, and ongoing maintenance. If your team doesn’t have dedicated DevOps engineers, a managed SaaS solution like Datadog, Dynatrace, or LogicMonitor may save significant time and reduce operational overhead.
3. Evaluate Deployment Model
Ask whether you prefer a **cloud-hosted SaaS** tool (Datadog, Dynatrace, LogicMonitor) or an **on-premises/self-hosted** solution (Prometheus, Grafana, Zabbix, Nagios). Hybrid environments often benefit from tools that support both models.
4. Check Integration Support
Your monitoring tool needs to speak the same language as your existing stack. Look for native integrations with your cloud provider (AWS, Azure, GCP), container orchestration platform (Kubernetes), CI/CD pipeline, ticketing system (Jira, PagerDuty), and communication tools (Slack, Teams).
5. Assess Alerting and Incident Management
Effective monitoring isn’t just about collecting data — it’s about getting the right alerts to the right people at the right time. Evaluate the alerting capabilities, noise reduction features, and on-call routing integrations of each tool.
6. Factor in Scalability and Cost
Free and open-source tools (Prometheus, Grafana, Zabbix, Nagios Core) have no licensing cost but carry infrastructure and engineering costs. Paid SaaS tools like Datadog and Dynatrace use consumption-based pricing that can scale significantly with your environment. Always model costs based on your expected data volumes and host counts.
7. Look for Unified Observability
Modern infrastructure monitoring goes beyond metrics alone. The best platforms offer unified observability bringing together metrics, logs, and traces in a single interface. Tools like Datadog and Dynatrace do this natively; in the open-source world, the Prometheus + Grafana + Loki stack achieves a similar result.
Conclusion
The infrastructure monitoring landscape has evolved significantly- today’s tools go far beyond simple uptime checks to deliver deep observability across hybrid, multi-cloud, and containerized environments. Whether you’re a growing startup standardizing on a Prometheus + Grafana stack, or an enterprise deploying Datadog or Dynatrace for end-to-end visibility, the right tool depends on your infrastructure complexity, team capabilities, budget, and long-term goals.
When evaluating your options, start with your requirements, shortlist tools that align with your architecture, and pilot them in a limited environment before committing. If you need guidance selecting or implementing the right infrastructure monitoring solution for your organization, [Sygitech’s IT infrastructure consulting services](https://www.sygitech.com/it-infrastructure-management.html) can help you navigate the options and build a monitoring strategy that scales with your business.